Measuring the volume of sand on a barge is harder than measuring a truck in two respects: the water level rises and falls with the tide, and the cargo in the hold lies hidden below the hatch coaming. Visual estimation or manual measurement gives each person a different number, with no evidence to cross-check at acceptance. The Smart Box AI truck and barge volume measurement solution from An Ninh Số addresses this problem with two independent methods: 3D scanning of the cargo hold using LiDAR and draft measurement on entry and on exit.
Smart Box AI measures sand on a barge using two independent methods: LiDAR 3D scanning of the cargo hold to produce m³, and the draft difference between entry and exit to produce the tonnage. The cargo is calculated against the barge's own hatch coaming, so the tide does not distort the result. If the two results differ by more than 8%, the case is forwarded to staff for confirmation. An error of ≤ ±5% is a proposed target, to be re-agreed by both parties based on the results of a 4-week trial run.
What is Smart Box AI?
Smart Box AI is a truck and barge volume measurement system developed by Việt Đức Trí Group, supplied and deployed by An Ninh Số. The system uses LiDAR 3D scanning, AI cameras to read truck license plates and barge registration numbers, and software that manages the entire trip cycle: identification, measurement, trip matching, reconciliation, and reporting.
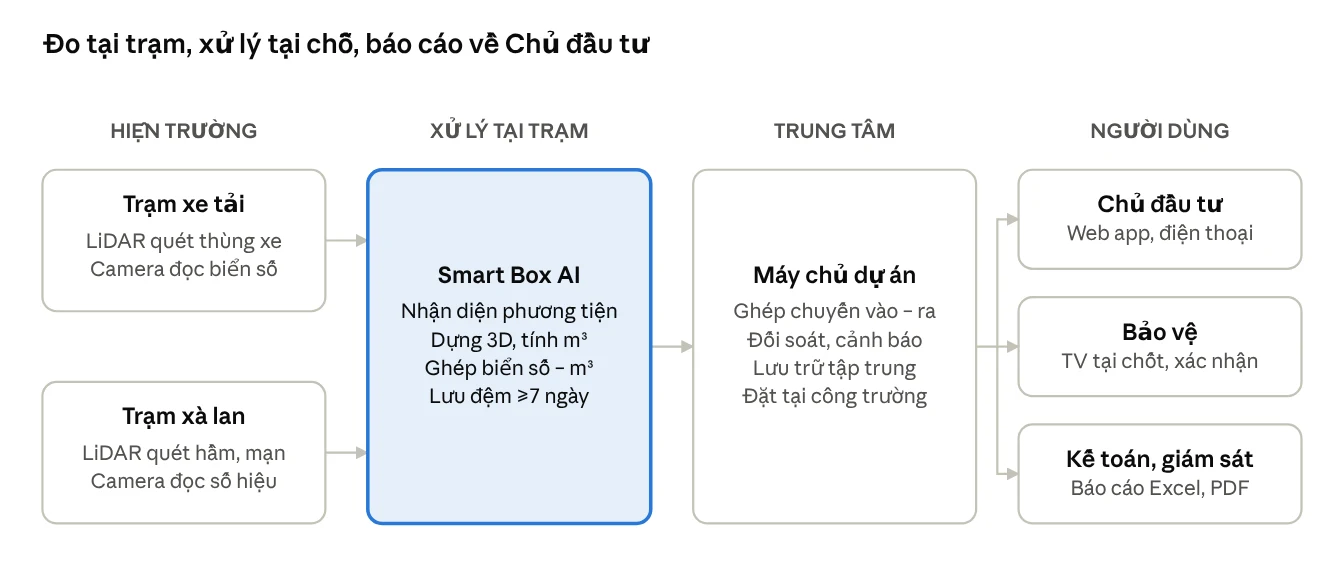
A project typically has two measurement stations in the field and one server at the site. The truck station is placed at the site, mine, or yard entrance and exit. The barge station is placed on the channel into the berth or the cargo intake port. Each station processes independently and produces results on the spot, then sends them to the center via VPN.
For barges, each trip produces a cargo volume in m³, a tonnage based on draft, and the cross-check result between the two methods. This is the basis for the Investor to accept and settle with the contractor transporting sand, soil, and stone by waterway.
5 steps to measure barge sand volume with Smart Box AI
A barge trip is measured twice, on entry with cargo and on exit empty, in 5 steps:
- The barge enters the channel: the camera detects it, reads the registration number, and notifies the guard for confirmation.
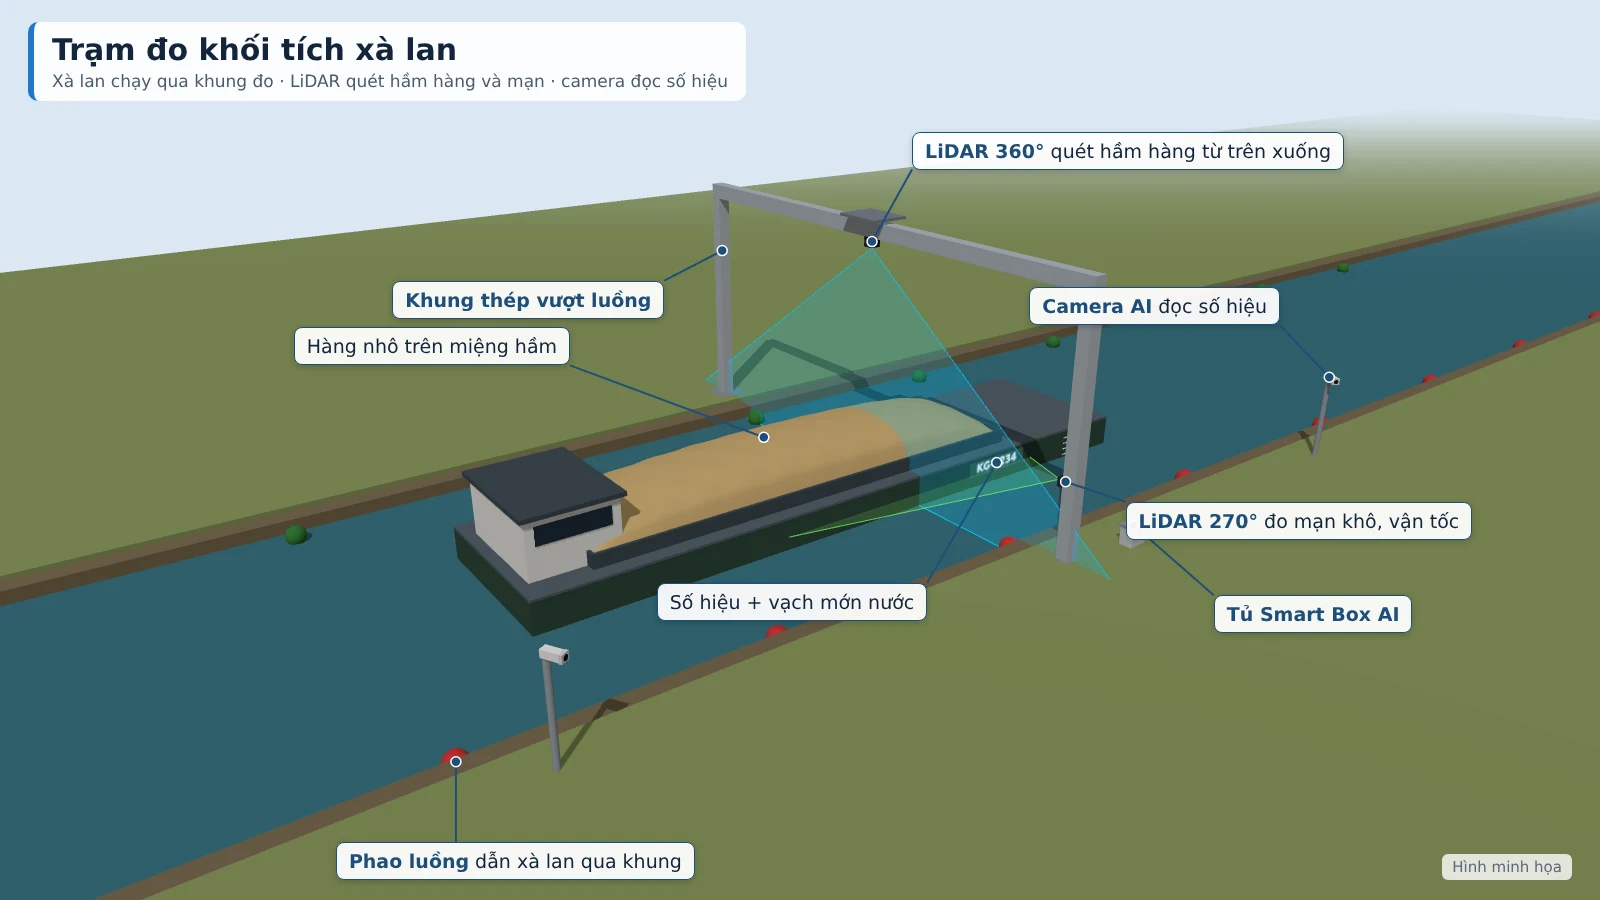
- The barge passes through the measurement frame at under 5 km/h along the channel buoys; LiDAR builds a 3D model of the cargo hold and measures freeboard.
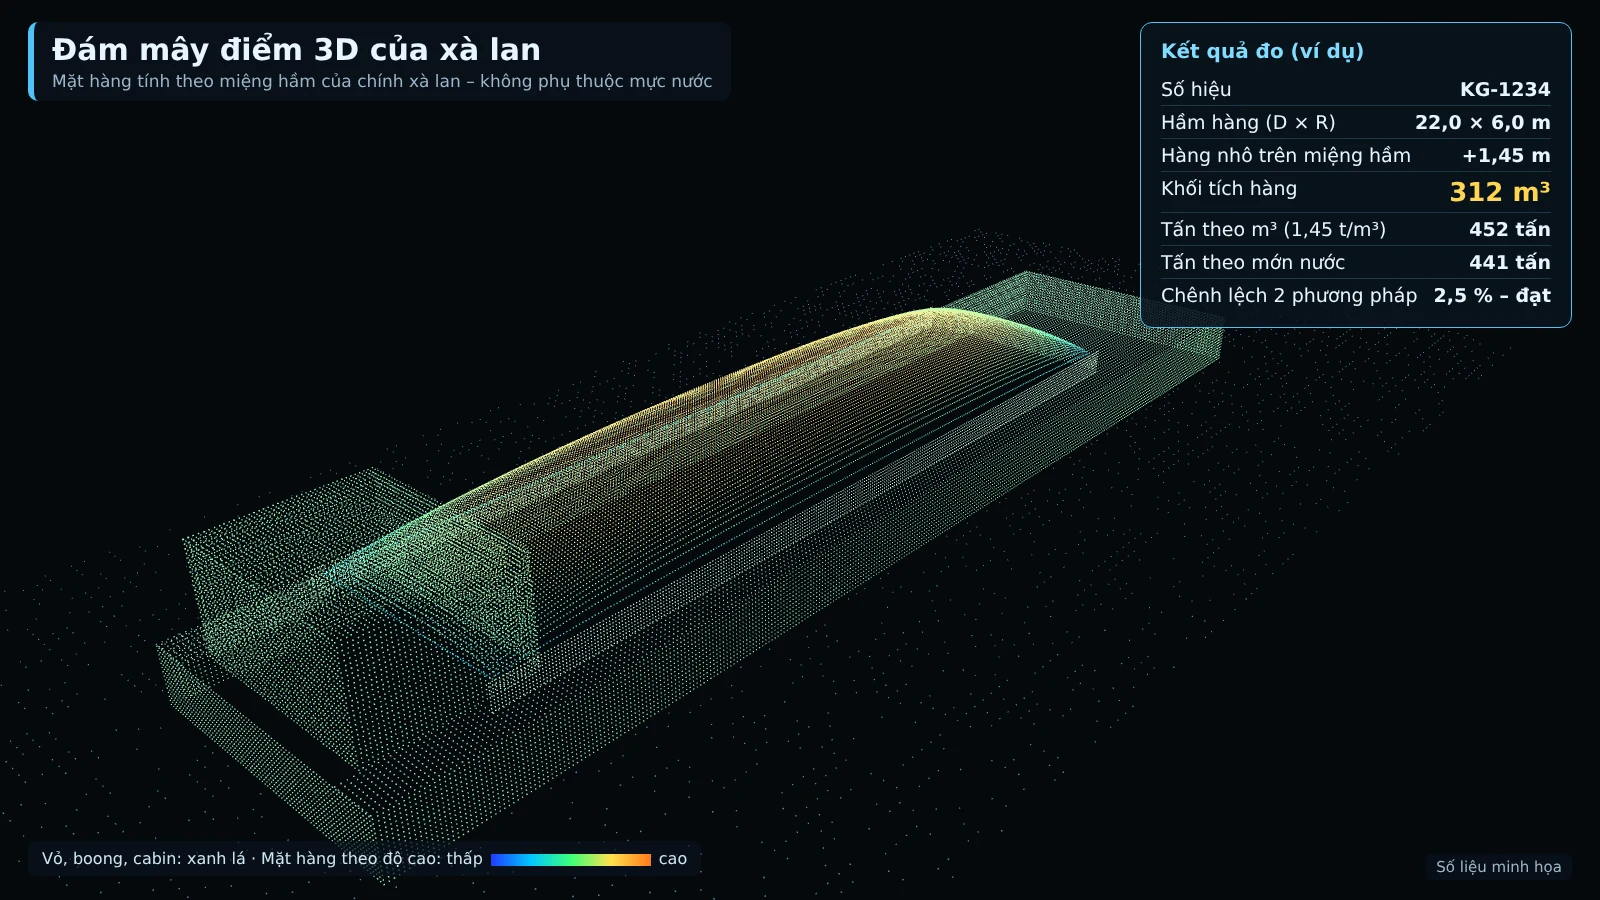
- The system calculates the cargo volume in m³: the portion inside the hold according to the registered hold profile, plus the portion of cargo protruding above the hatch coaming.
- The empty barge exits: the hold and freeboard are measured again.
- The draft difference between entry and exit produces the cargo tonnage; the system compares it with the tonnage converted from m³ and closes the trip.
The foundation of the entire process is the hold profile. Each barge is registered once with its hold dimensions, capacity, and waterplane area according to its registration documents, then verified by the first empty scan. From then on, every subsequent measurement is compared against this profile, so the cargo hidden below the hatch coaming is still calculated correctly according to the actual shape of the hold.
Why is the system independent of tides?
The cargo is measured against the barge's own hold opening, not against the water surface. The tide raises or lowers the entire barge hull at the same time, while the distance from the cargo surface to the hold opening stays unchanged, so the m³ figure is not affected.
The tonnage based on draft also does not rely on a fixed elevation benchmark on shore. The system measures the barge's freeboard when it enters loaded and when it leaves empty; the difference between the two measurements taken on the barge hull itself is what reflects the weight of cargo unloaded.
In terms of structure, the measurement frame is designed so that the barge can pass at any water level: the bottom of the frame is at least 3 m higher than the barge's side at minimum high tide. Buoys guide the barge through the middle of the frame so that the LiDAR scans the entire cargo hold and side.
Core technology of the system
The barge station consists of four main groups of equipment:
- 360° LiDAR scans the cargo hold from above, building a 3D model of the cargo surface.
- 270° LiDAR scans the side, measuring speed and draft.
- AI camera reads the barge identification number on both sides, operating day and night.
- Edge computer builds the 3D model and runs the Smart Box AI software right at the station.
LiDAR emits laser beams and measures the response time to determine the distance to each point on the surface. As the barge passes, successive cross-sections are stitched together into a point cloud, from which a 3D model of the cargo pile is built. Because LiDAR also measures speed, the system stitches the cross-sections in the correct position even when the barge does not move at a constant speed.
Cross-check and verification process
Each trip has two independent tonnage figures: tonnage converted from the 3D-scanned m³ and tonnage based on the draft difference. If the two results match, the trip is recorded automatically; if they deviate by more than 8%, it is forwarded to staff for confirmation.
Tonnage converted from m³ is based on the density table by material type issued by the Investor. The density of sand varies with moisture and compaction, so cross-checking against the draft helps detect early when the coefficient in use is no longer close to reality.
In addition to the deviation threshold, each measurement is scored for confidence from 0–100 based on speed, occlusion and weather. A measurement with a low score is also automatically moved to the verification queue. Here, staff review the photos, 3D model and camera clips, then approve, adjust or reject the trip. All changes are logged, and only the Investor may adjust the m³ figure.
Comparison table of traditional measurement methods and Smart Box AI
The main difference lies in the basis: traditional methods rely on the person measuring and paper records, while Smart Box AI gives each trip a data set including the identification number, photos, 3D model, m³ and tonnage cross-checked between the two methods.
| Criterion | Traditional method | Smart Box AI |
|---|---|---|
| How volume is determined | Visual estimation, manual measurement or manual draft reading | 3D scanning of the cargo hold and draft measurement, with automatic cross-checking between the two methods |
| Volume error | Depends on the operator's experience | Proposed target ≤ ±5%, to be re-agreed based on the results of a 4-week trial run |
| Tidal influence | Easily affected when the water surface is used as the benchmark | Calculated against the barge's own hold opening |
| Time to result | Depends on the manual measurement process | Proposed target ≤ 60 seconds |
| Evidence | Paper records | Photos, camera clips, 3D model of the cargo pile |
| Anomaly detection | Detected late, during end-of-period reconciliation | Real-time alerts: unknown vehicles, deviation between the two methods, equipment faults |
Technical requirements for deployment
Each barge station is a complete set comprising a steel structure, sensors, cameras, a processing unit and an electrical cabinet. The steel structure is fabricated to actual dimensions after the survey.
- Steel frame spanning the channel or a pillar with a cantilever arm of 6–8 m.
- The bottom of the frame must be at least 3 m above the barge's side at peak tide.
- Channel buoys guide the barge through the middle of the frame; a 5 km/h speed limit sign.
- IP65 electrical cabinet with fan and dehumidifier, UPS, surge protection for power and network, earthing.
- Power consumption of about 1.9–2.4 kWh/day, running 24/7.
The Investor is responsible for preparing: the location for the measurement frame; grid power or a generator to the station (if not available, An Ninh Số offers an additional dedicated solar system); the list of barges from each contractor together with registration documents (hold dimensions, draft); a table of density by material type; and a requirement for contractors to pass through the measurement frame at the correct speed.
Calibration and acceptance of the barge station
The station is calibrated on site, run for a 4-week trial, and only then accepted. The targets below are proposed targets, to be re-agreed by both parties based on the results of the 4-week trial run.
- Reference block: place a steel block of known dimensions under the measurement frame to align the sensors.
- Hold template: measure each barge's hold when empty and compare with the registration documents.
- Cross-check: compare results with manual draft survey.
- Periodic: re-check with the reference block every month and after each relocation of the station.
Proposed targets for the barge station: measured-trip rate ≥ 90%; volume error ≤ ±5% compared with the cross-check; correct vehicle identification ≥ 95% (with guard confirmation); results available in ≤ 60 seconds; station uptime ≥ 98%/month. Acceptance is based on 10 barge trips with cross-checks over 7 consecutive days; the software exports a comparison table of measured m³, cross-check m³ and the error for each trip for both parties to sign and confirm.
Data management and security
Each barge trip is stored as a record comprising:
- Barge number, contractor, entry and exit times
- Identification photo and camera clip
- 3D image of the cargo pile, rotatable and zoomable
- m³ of cargo, tonnes by draft, cross-check result of the two methods
- Measurement confidence score (0–100)
Data is stored on site and on the project server, not uploaded to external services. The station sends results to the center via VPN; when the network is lost, the station keeps measuring, buffers at least 7 days and automatically resends when connectivity is restored.
The software provides role-based permissions for the Investor, supervision, security, accounting and administration. Reports are exported to Excel and PDF by day, shift, week and month, with trucks and barges separated. Instant alerts appear on the web app, on a TV at the security post and are sent as messages to the responsible officer when there is an unknown vehicle, when the two methods diverge, or when the LiDAR, camera or power supply loses signal.
Regulatory context for river mining supervision
The draft decree detailing the Law on Geology and Minerals, put out for consultation by the Ministry of Agriculture and Environment (03/2025), proposes installing smart AI cameras at locations where minerals are transported out of the mining site; for mining on rivers, lakes and seas, it is proposed to install journey monitoring and cameras. This is draft content, not yet a regulation in effect.
Smart Box AI already records the number, time, photo and m³ for each barge trip. Connection to the management agency's system will be carried out according to official guidance when issued.
Related solutions
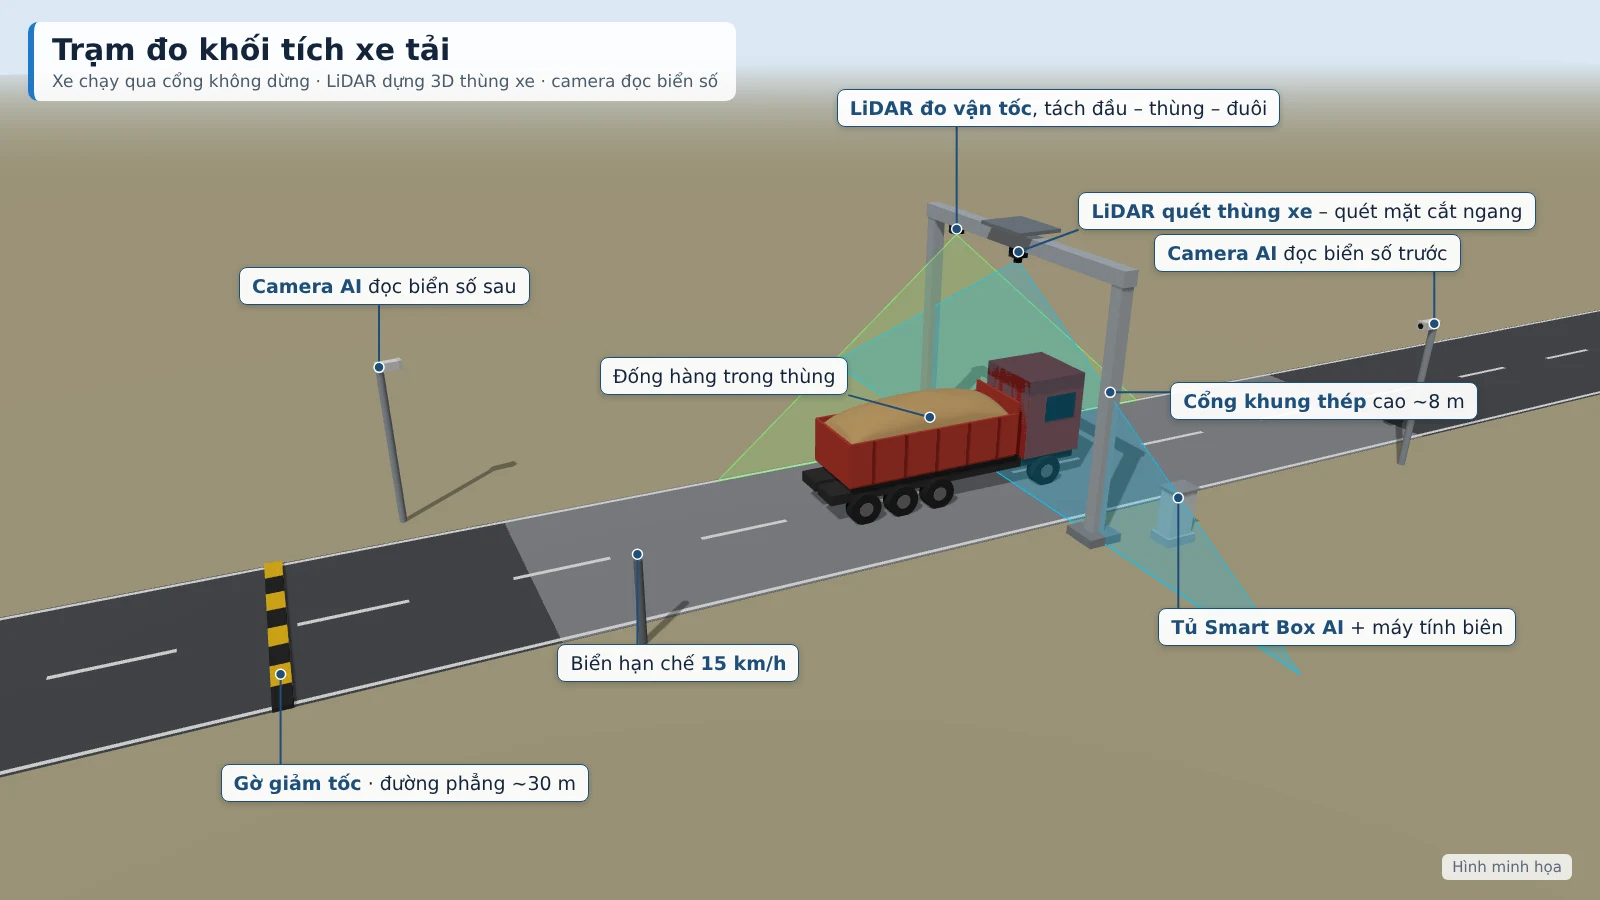
Truck & barge volume measurement — Smart Box AI: 3D LiDAR and AI cameras measure m³ per trip, vehicles do not need to stop; each trip has a license plate, photo and 3D image as a basis for acceptance. View the solution, book an on-site survey →
Frequently Asked Questions
Does the system work at night?
Yes. The barge station runs 24/7; the cameras reading barge registration numbers on both sides operate day and night, and the LiDAR scanning the cargo hold and sides does not depend on light. A measurement affected by speed, obstruction or weather will have a low confidence score and be automatically forwarded to staff for verification.
How is the system's accuracy ensured?
The station is calibrated on site: the hold profile of each barge is measured when empty and compared with the registration records, cross-checked by manual draft survey. It is then re-checked with a reference block every month and after each relocation of the station. A volume error of ≤ ±5% for barges is a proposed target, to be re-agreed by both parties based on the results of a 4-week trial run.
Do barges need to stop for measurement?
No. Barges pass through the measurement frame at under 5 km/h along the buoy line and do not have to stop. The LiDAR also measures velocity to build an accurate 3D image of the cargo hold while the barge is moving.
Where is data stored, and is it lost when the network goes down?
All data is stored on site and on the project server, not uploaded to any external service. Each station processes data locally; when the connection is lost, the station keeps measuring, buffers data for at least 7 days and automatically resends it to the server via VPN once the network is restored.
Can the system connect to the software we are currently using?
Yes. The system exports Excel/CSV and provides an API to connect to the weighbridge or the project's accounting software. Matching m³ figures with the weighbridge to track actual bulk density is a project-based extension, configured during the site survey.
How is it handled when the measurement results from the two methods differ greatly?
When the tonnage from the 3D scan and the tonnage from the draft differ by more than 8%, the system moves that trip to the pending verification queue. Staff review the photos, 3D image and camera clips and then approve or adjust; every change is logged, and only the Investor may adjust the m³ figures.
Want to know where the measurement frame would be placed at your wharf or port and what preparation is needed? An Ninh Số conducts an on-site survey, proposes a station configuration and gives a live demonstration according to the Investor's schedule. See details of the solution truck and barge volume measurement with Smart Box AI or call the hotline 0796 700 777.