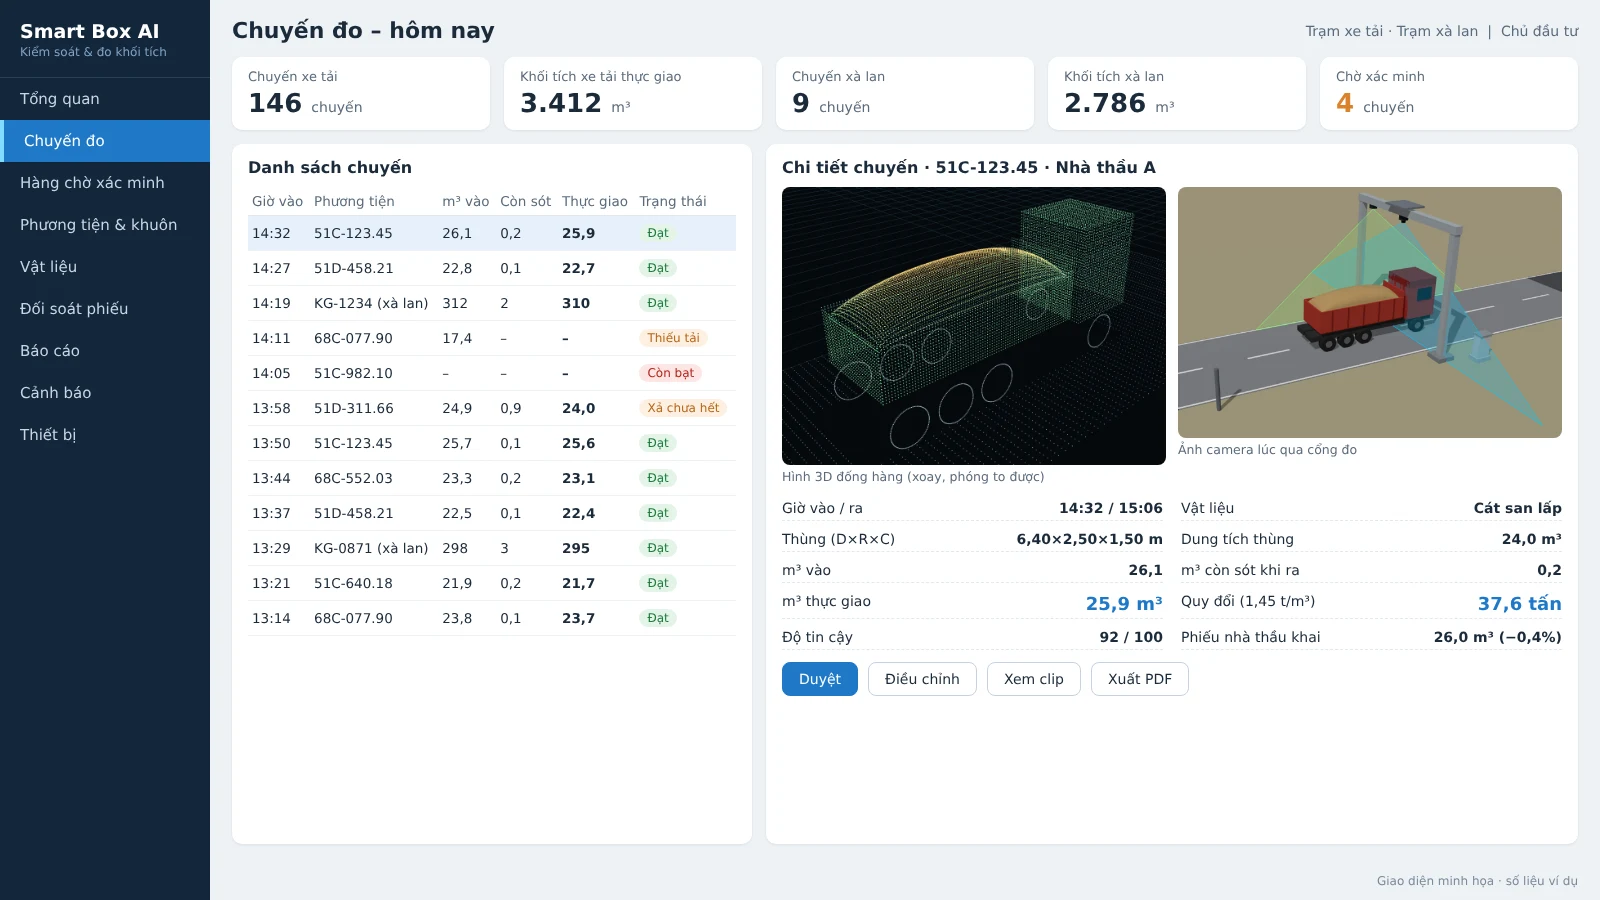
Backfill sites, mines, storage yards and inland waterway ports receive hundreds of material trips every day. Without independent measurements, small per-trip discrepancies add up to large payments to contractors. Trip-based material volume management software addresses exactly this: it turns data from 3D LiDAR and AI cameras at the measurement station into reconcilable trip records — who hauled it, how much, when it was measured, what the photos and clips show, and which trips need verification.
This article is for investors, project management boards and project accountants, based on the software of Smart Box AI — the truck and barge volume measurement system developed by Việt Đức Trí Group, supplied and deployed by An Ninh Số.
Trip-based material volume management software records every truck or barge pass through the measurement station, storing the license plate or vessel number, photos, 3D images, clips and confidence score; it automatically calculates actual delivered m³ = inbound m³ − remaining m³; exports reports by shift, contractor and vehicle; and moves low-quality measurement trips into a verification queue before payment reconciliation.
What is trip-based material volume management software?
This is centralized management software that records each material transport trip. Each trip is linked to the vehicle's license plate or vessel number, the contractor, entry and exit times, measured m³, photos, 3D images of the material pile, camera clips and a confidence score of 0–100. The software automatically pairs entry passes with exit passes, calculates the actual delivered volume, flags trips that need verification, and exports reports by shift, day, week, month, by contractor and by vehicle.
Quantity takeoff software or materials management software leans toward warehouse operations: inbound, outbound, inventory. Trip-based volume management software works directly with sensor data in the field. Each trip is a record with accompanying evidence; every change is logged. This chain of evidence is the basis for acceptance and payment. You can also refer to the guide on calibration and acceptance of LiDAR volume measurement systems to understand the technical foundation behind it.
Smart Box AI software runs as a web app. Investors monitor it on computers and phones; security staff at the gate view it on TV and confirm trips on the spot. Data is organized across five main screens: overview, trip list, trip details, verification queue and catalogs.
Overview screen: what to look at when starting a shift?
The overview screen answers four questions: how many trips have there been today, what the total m³ is, what state the measurement stations are in, and whether there are any new alerts that need handling. This is the opening screen of the working day for the project management board and the monitoring department.
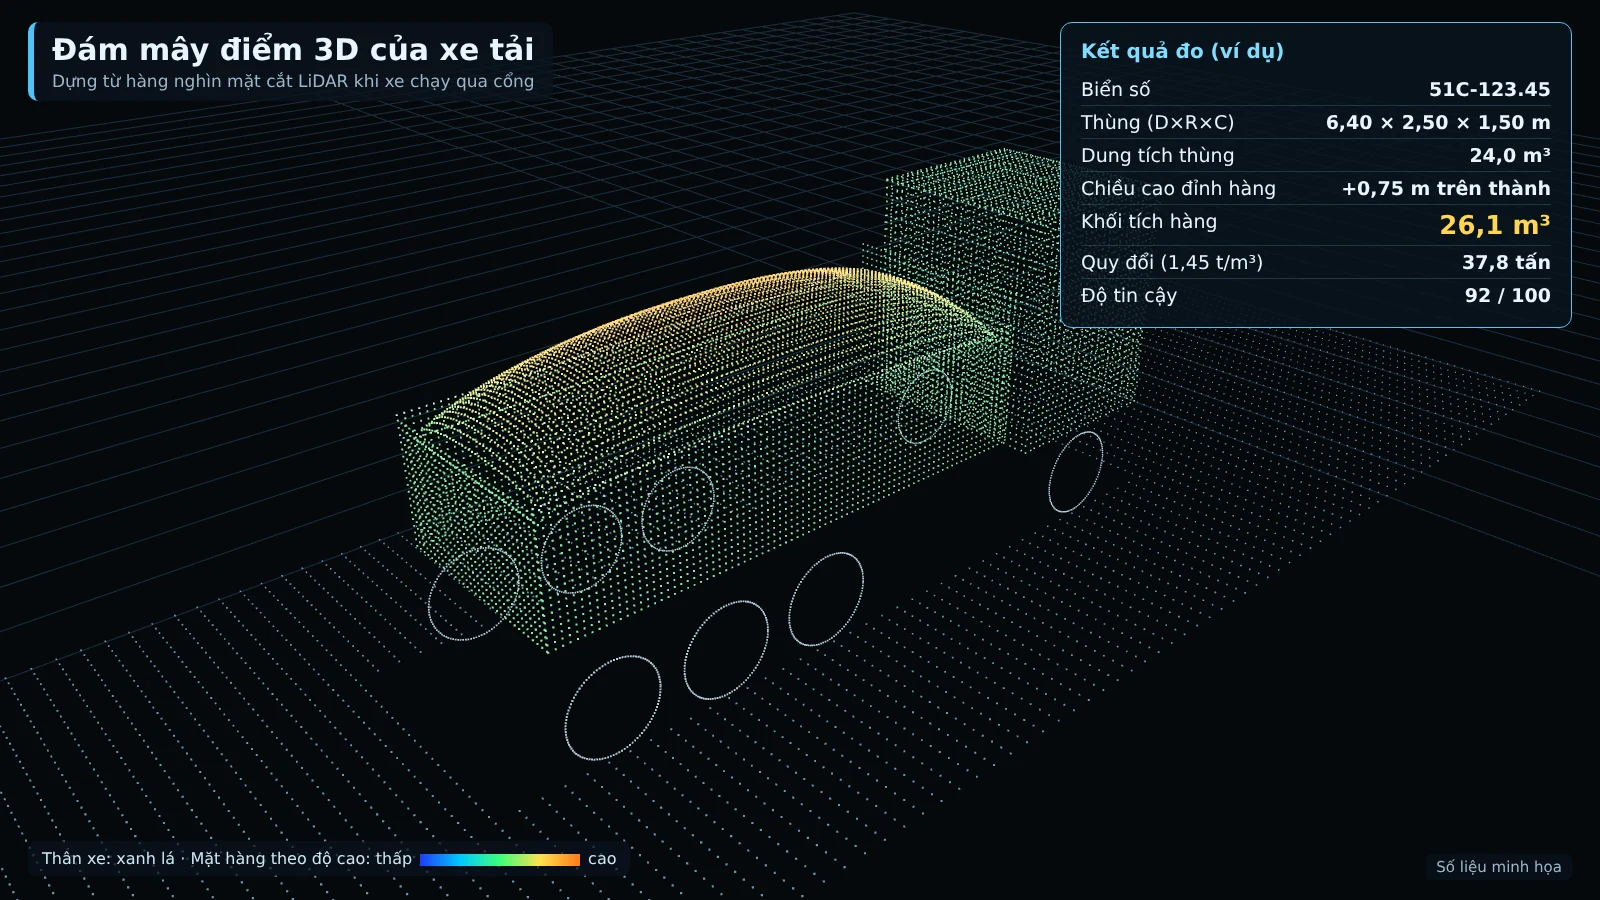
The overview screen includes:
- Number of trips and total m³ today, listed separately for trucks and barges.
- Station status: LiDAR, camera, power supply, connection; which station has lost signal, which sensor glass needs cleaning.
- New alerts: underloaded trip, exceeding the bed walls, incomplete discharge, measurement failure, unknown vehicle.
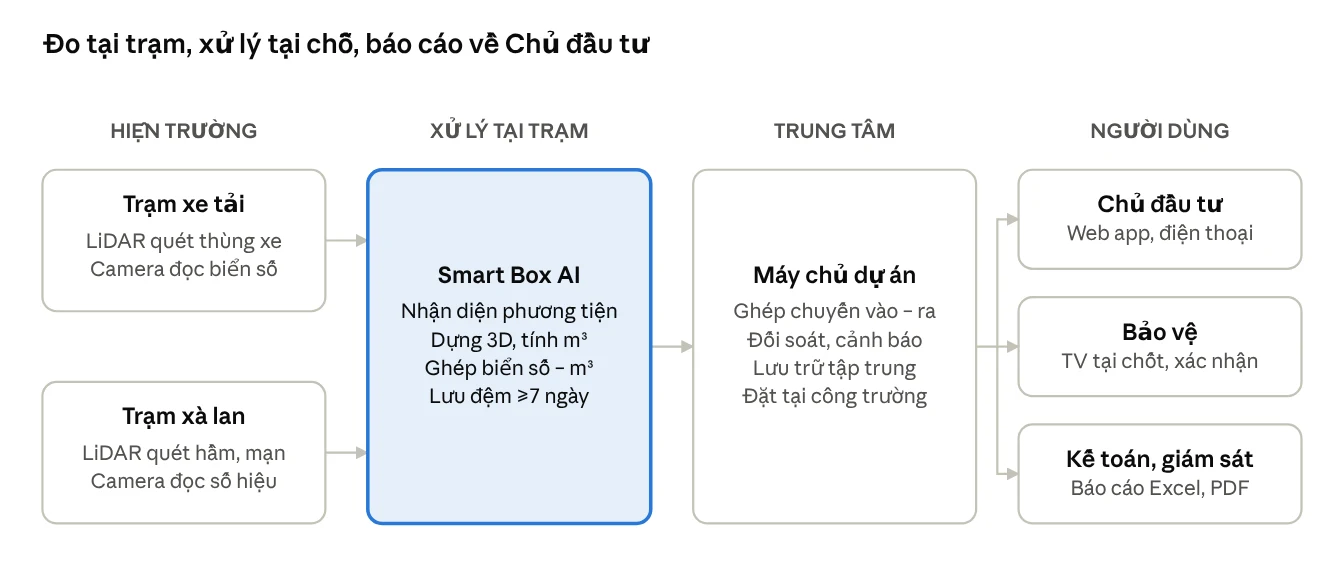
Each station processes independently and produces results on the spot using an edge computer, then sends the results to the center via VPN. The solution page measuring the volume of trucks and barges describes the station architecture and how data is synchronized in detail.
Trip list and trip details: what is stored for each trip?
The trip list displays time, image, license plate or ID number, contractor, m³ in, m³ remaining, m³ actually delivered, converted tons and status. When opening the trip details, the user can review all the evidence: identification image, 3D model, material pile cross-section, comparison with the bed template and camera clip.
The principle of measuring twice per trip is the backbone of the system. The vehicle is measured on entry when the bed is loaded and on exit when the bed is empty, at the same gate. The actually delivered volume is calculated as m³ in − m³ remaining. This approach eliminates disputes about material sticking to the bed or incomplete discharge.
For trucks, each trip records:
- Vehicle: front and rear license plate, contractor, clearest image.
- Time: entry time, exit time, time spent inside the site.
- Dimensions: length, width, height of the truck bed and of the material pile.
- Volume: m³ in, m³ remaining, m³ actually delivered, material protruding above the bed walls.
- Weight: tons converted by material type.
- Confidence: measurement quality score from 0 to 100.
The trip details consist of the following information blocks:
- Identification image of the vehicle as it passes the gate.
- 3D model of the material pile, rotatable and zoomable to inspect the load.
- Cross-section and template comparison: comparing the material pile cross-section with the registered bed template of that same vehicle, helping detect raised bed walls or vehicle substitution.
- Camera clip of the vehicle passing the gate.
- Confidence score 0–100 of the measurement; a poor measurement is automatically moved to the pending verification queue.
For barges, the trip details additionally include the tonnage based on draft on entry and on exit, cross-checked against the tonnage converted from m³. Every change to the data is logged: who changed it, when, and for what reason. This is something traditional spreadsheets cannot do. For projects with many subcontractors, the audit trail helps digitize each truck trip into acceptance evidence instead of disputes.
Reports by day/shift/week/month and by contractor, vehicle
The software exports volume reports by day, shift, week, month, separating trucks and barges; it also breaks them down by contractor and by individual vehicle. For each contractor, the report shows average m³ per trip, bin fill rate and the number of underloaded trips to detect anomalies.
Four main report groups, exported to Excel or PDF:
- Volume by time period: day, shift, week, month; number of trips, total m³, converted tonnes, separating trucks and barges.
- By contractor and individual vehicle: average m³ per trip, bin fill rate, number of underloaded trips.
- Payment reconciliation: declared m³, measured m³, variance, list of adjusted trips and the approver.
- System activity: measured trip rate, number of trips requiring verification, uptime of each station.
The reconciliation report is the project accounting document used most often. The software compares measured m³ with the registered capacity and with the contractor's delivery notes; if there are multiple gates, trips between gates are also reconciled. This organization is similar to acceptance of backfill material volume through digital transformation: the source data must be automatic, traceable and verifiable.
Verification queue: when is a trip pushed to it?
A trip enters the verification queue when a measurement has a low confidence score, when the station cannot measure, or when a barge has results from two methods that differ significantly. Each trip in the queue comes with a reason; staff review the photos, 3D images and camera clips, then approve, adjust or reject it.
Common cases:
- Low confidence score: a score of 0–100 is assigned based on speed, occlusion and weather; a poor measurement is automatically sent for verification.
- Unable to measure: the vehicle is still covered by a tarpaulin, is moving too fast, or two vehicles are too close together.
- Two methods disagree: for barges, tonnes by 3D scan and tonnes by draft differ by more than 8%.
In addition to the queue, the system also issues instant alerts as soon as a vehicle passes the gate: underload (by default below 85% of bin capacity), overtopping (load pile higher than the bin wall by more than 0.3 m), incomplete discharge (more than 0.5 m³ remaining when the vehicle leaves), unknown vehicle, dimensions deviating from the template. Thresholds are configured by the Investor. Alerts appear on the web app, on the TV at the security post and are sent as messages to the responsible staff.
Queue processing procedure:
- The system places the trip in the queue with a specific reason.
- Staff open the trip details, view the photos, 3D images, cross-sections, template comparison and clip.
- Staff approve if the data is sufficiently reliable, reject if the trip is invalid, or forward it for adjustment.
- Only the Investor may adjust the m³ figure; every change is logged.
- Processed trips return to the reporting and payment reconciliation flow.
The verification queue forces the project to resolve each low-confidence trip before closing the numbers. Security guards do not have to scrutinize every trip; they only need to confirm the trips flagged by the system. To learn more about barge measurement, see the article measuring sand volume on barges with 3D and AI technology.
Permissions: who can do what in the system?
The system assigns permissions across five roles: Investor, supervisor, security, accountant and administrator. Only the Investor may adjust the m³ figure of a trip; the other roles work within their assigned scope.
A commonly used division of roles:
- Investor: view everything, adjust m³, configure alert thresholds, issue separate density tables by material type.
- Supervisor: monitor trips, view evidence in the verification queue, approve or propose adjustments.
- Security: view on the TV at the post, confirm the trips flagged by the system, confirm barge registration numbers.
- Accountant: use payment reconciliation reports, export to Excel, cross-check with the contractor's delivery notes.
- Administrator: manage accounts, vehicle lists, contractors, bin templates and hold templates.
The principle that only the Investor may adjust m³ stems from reconciliation practice: if multiple roles can edit, the record loses its evidentiary value. The reconciliation report always includes the list of adjusted trips and the approver, serving internal checks.
Infrastructure connectivity: Excel/CSV, weighbridge API, accounting software
The per-trip material volume management software does not stand alone. The system exports Excel/CSV for payment records and provides an API to connect to the project's weighbridge or accounting software. In parallel, the system monitors devices and alerts when signal is lost or sensor glass is dirty.
- Excel/CSV export for shift reports, contractor reports, and payment reconciliation reports.
- API to connect to the weighbridge or accounting software, avoiding double manual entry.
- Device monitoring: tracking LiDAR, cameras, power supply, and connectivity; alerting when signal is lost or sensor glass needs cleaning.
- Shared camera infrastructure: the guard booth and control center can share the recorder, TV, and server of the existing camera system.
Many sites already have a weighbridge. When integrated via API, each trip has both m³ measured by LiDAR and tons from the weighbridge, allowing cross-checking of two independent sources and tracking the actual bulk density of each material type over time. This is a project-based extension item, configured during the survey of the existing weighbridge.
The Smart Box AI station still measures when the network is down, buffers data for at least 7 days, and automatically resends when connectivity is restored. All data is stored on site and on the project server, not sent to any external service.
Site operations: how do trucks and barges pass through the station?
Trucks drive through the steel frame gate at under 15 km/h without stopping; LiDAR builds a 3D model of the truck bed while cameras read the license plate at the same time. Barges pass through the measurement frame at under 5 km/h along the buoy line; LiDAR builds a 3D model of the cargo hold and measures freeboard. Not having to stop helps maintain transport flow while still capturing complete data for each trip.
For barges, the system uses two independent methods: 3D scanning of the cargo surface in the hold and measuring draft on entry compared with on exit. The cargo is calculated against the barge's own hold opening, not the water surface, so tides do not distort the result. If the two results match, the trip is recorded automatically; if they differ significantly, it is forwarded to staff for confirmation.
The figures below are proposed targets, to be re-agreed by both parties based on the results of a 4-week trial run, not commitments:
- Volume error versus reference ≤ ±3% for trucks (trips from 10 m³); ≤ ±5% for barges.
- Time to result ≤ 30 seconds for trucks; ≤ 60 seconds for barges.
- Measured trip rate (passing the station as required) ≥ 95% for trucks; ≥ 90% for barges.
Acceptance is based on 50 truck trips and 10 barge trips with reference measurements over 7 consecutive days; the software exports a comparison table of measured m³, reference m³, and per-trip error for both parties to sign off. For projects with high control requirements, it is worth reading more on AI license plate recognition cameras at the site gate to understand how vehicle identification works day and night.
Summary table of terms and concepts
The table below summarizes the terms commonly encountered when working with per-trip material volume management software, helping investors, contractors, and accountants align on how they are understood.
| Term | Definition | Example |
|---|---|---|
| Trip | The loaded entry and empty exit of the same vehicle through the measurement gate, paired by the system | The entry and exit with the same license plate are paired into one trip |
| Actual delivered m³ | The actual delivered volume of the trip = entry m³ − residual m³ | Cargo still clinging to the bed on exit is subtracted from the m³ on entry |
| Confidence score | A 0–100 scale rating measurement quality by speed, occlusion, and weather | A low-score measurement is automatically sent for verification |
| Pending verification queue | The list of trips that staff need to review, with reasons, before finalizing | A truck still covered with a tarp when passing the gate |
| Bed profile | The inner bed dimensions and bed floor recorded when the empty truck passes through the gate 3 times | Detecting a raised bed side or a swapped vehicle |
| Bed fill rate | The ratio between the measured cargo m³ and the registered bed capacity | Comparing load levels between contractors |
| Underloaded trip | Cargo m³ below the registered level, default 85% of bed capacity | Threshold set by the Investor |
Common mistakes during deployment
The most common mistake is using the software as a digital notebook instead of a system with evidence. The second mistake is giving multiple roles permission to adjust volumes. The third mistake is skipping the verification queue and locking in figures immediately, which makes the records lose their value during reconciliation.
- Storing only the numbers, not the evidence: without photos, 3D images, or clips, reconciliation is impossible when the contractor raises questions.
- Letting multiple roles edit m³: records lose their evidentiary value and internal disputes are more likely.
- Skipping the verification queue: figures are locked in quickly, but at payment time everything has to be reviewed from scratch.
- Not letting vehicles exit through the measurement gate: without empty exit passes, the remaining m³ cannot be calculated.
- Not monitoring the equipment: the station loses signal or the sensor glass gets dirty without anyone knowing, and data is continuously missing.
- Sending data to external services: contrary to the investor's security requirements, and the data lifecycle is hard to control.
The draft decree detailing the Law on Geology and Minerals put out for consultation by the Ministry of Agriculture and Environment (03/2025) proposes installing smart cameras with AI at locations where minerals are transported out of the mining site. Note that this is a draft and not yet in effect. Smart Box AI already records the license plate, vehicle number, time, photo, and m³ for each trip; connection to the management agency's system will follow official guidance once issued.
Related solutions
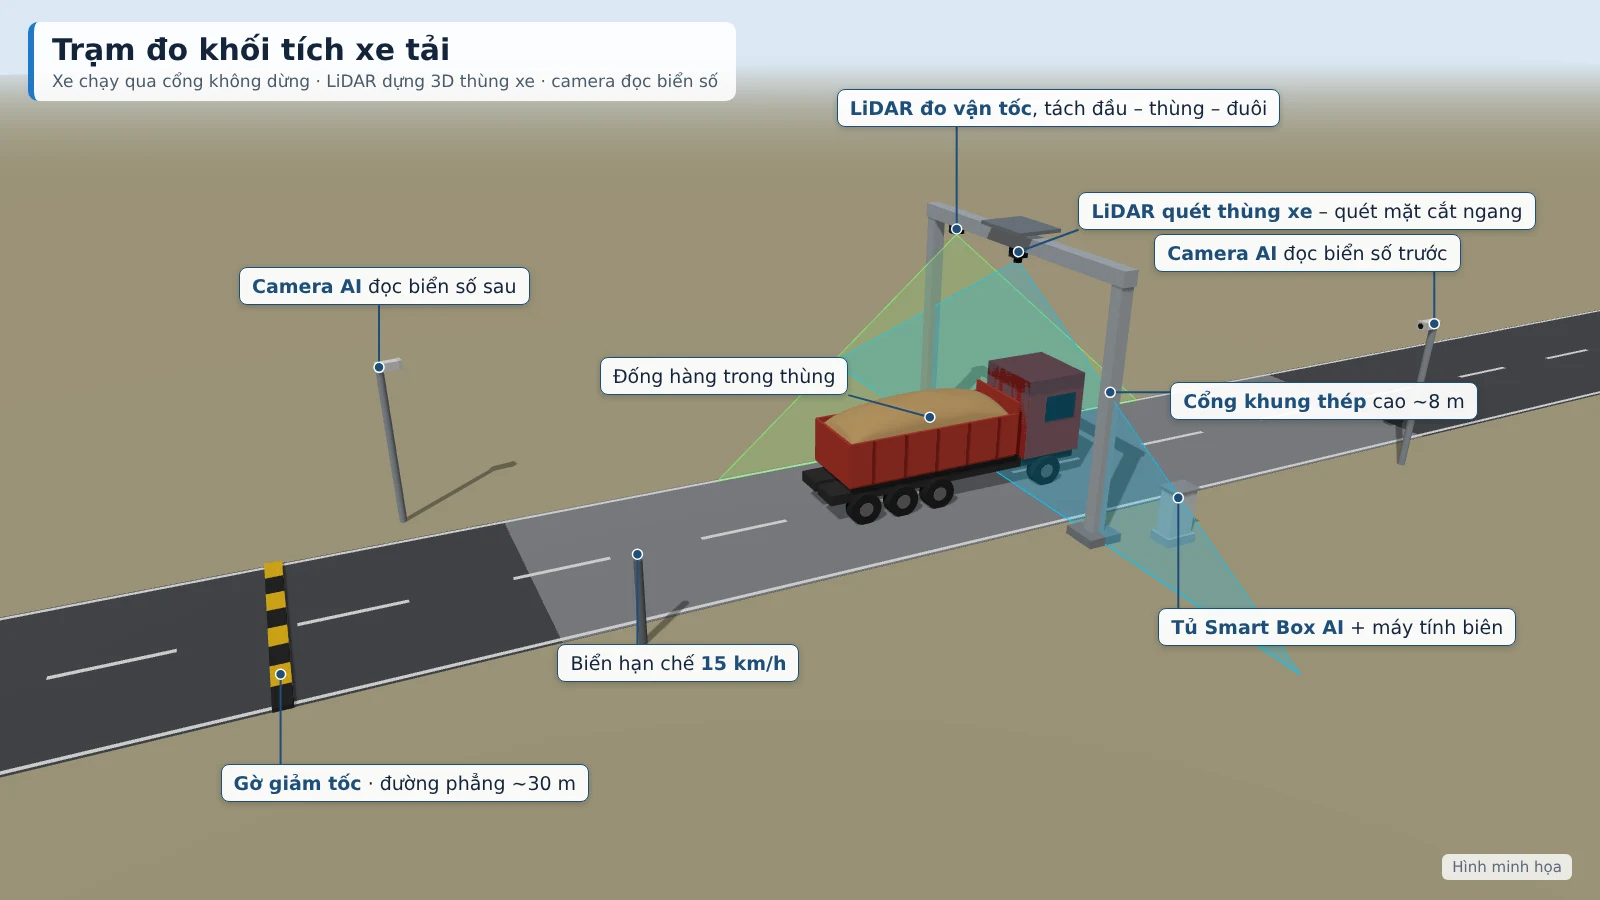
Truck & barge volume measurement — Smart Box AI: 3D LiDAR and AI cameras measure m³ per trip, with no need for the vehicle to stop; each trip has a license plate, photo, and 3D image as the basis for acceptance. View the solution, book an on-site survey →
Frequently Asked Questions
The section below compiles frequently asked questions from investors, project management boards and project accountants when considering deploying per-trip material volume management software.
How is per-trip material volume management software different from construction material management software?
Construction material management software focuses on receipts, issues, inventory and norms. Per-trip volume management software works directly with sensor data in the field: each trip is linked to a license plate or identification number, photos, 3D images, clips and a confidence score. It serves the reconciliation of actual delivered volumes and contractor payments.
Why must each trip be measured twice?
The vehicle is measured on entry when the bed is loaded and on exit when the bed is empty, at the same gate, to deduct the material remaining in the bed. Actual delivered volume = m³ on entry − m³ remaining. This approach reduces disputes with contractors and reflects the actual amount of material delivered.
Who is allowed to adjust the m³ volume in the system?
The system assigns permissions across five roles: Investor, supervisor, security, accountant, administrator. Only the Investor may adjust the m³ figures. Every change is logged, and the payment reconciliation report lists the adjusted trips together with the approver.
When is a trip placed in the verification queue?
When a measurement has a low confidence score (scored on speed, occlusion, weather), when the station cannot measure because the vehicle is still covered by a tarpaulin, is moving too fast or two vehicles are too close together, or when a barge's tonnage by 3D scan and by draft differ by more than 8%. Staff review the photos, 3D images and clips, then approve, adjust or reject.
If the network is down, can the station still measure, and where is the data stored?
Yes. Each station processes independently and produces results on site, buffers at least 7 days and automatically resends once connectivity is restored. All data is stored at the construction site and on the project's server, not uploaded to external services; the stations send results to the center via VPN.
Can it connect to weighbridges and existing accounting software?
Yes. The system exports Excel/CSV and has an API to connect to the project's weighbridge or accounting software. Combining LiDAR-measured m³ with tonnes from the weighbridge to track actual specific volume is a project-based extension, configured during the survey of the existing weighbridge. The volume measurement station does not replace the weighbridge.
Do trucks have to stop when passing through the measurement station?
No. Trucks drive through the steel frame gate at under 15 km/h; barges pass through the measurement frame at under 5 km/h along the buoy line. Not having to stop helps maintain transport flow and avoid congestion at the construction site gate.
Are the error and time-to-result figures commitments?
No. A volume error of ≤ ±3% for trucks (trips from 10 m³), ≤ ±5% for barges, a time to result of ≤ 30 seconds for trucks and ≤ 60 seconds for barges are proposed targets, to be re-agreed by both parties based on the results of a 4-week trial run. Acceptance is based on 50 truck trips and 10 barge trips with cross-checks over 7 consecutive days.
To assess whether per-trip material volume management software suits your project, the first step is a site survey and a demonstration of the measurement station. An Ninh Số surveys the locations for the measurement gate, measurement frame, power supply and the flow of trucks and barges; proposes the station configuration and demonstrates it live according to the Investor's schedule. Call the hotline 0796 700 777 to book a survey; solution details on the Smart Box AI truck and barge volume measurement page.