Controlling vehicles carrying sand, soil and stone at land-fill sites, mines and storage yards usually relies on visual estimation or manual measurement. Everyone comes up with a different number, and there is no evidence to cross-check at acceptance. With hundreds of trips per day, small per-trip discrepancies add up to large payment amounts. This article analyses common loopholes and how Smart Box AI measures the volume of trucks and barges from An Ninh Số using 3D LiDAR and AI cameras to measure each trip, flag abnormal trips and reconcile with contractors.
Smart Box AI measures m³ for each truck and barge trip using 3D LiDAR, with AI cameras reading license plates and registration numbers. Each vehicle is measured twice, once on entry with cargo and once on exit empty, to calculate the actual delivered m³; trips that are underloaded, over the side walls, not fully discharged, with a mismatched bed profile or with an unknown vehicle are flagged immediately as they pass the gate. Every adjustment is logged, the station keeps measuring when the network is down and sends the backlog once connectivity returns.
What is Smart Box AI?
Smart Box AI is a truck and barge volume measurement system that uses 3D LiDAR to scan point clouds combined with AI cameras to recognise license plates and registration numbers. The system is developed by Việt Đức Trí Group and deployed by An Ninh Số, comprising two types of on-site measurement stations and trip management software running on a server at the site.
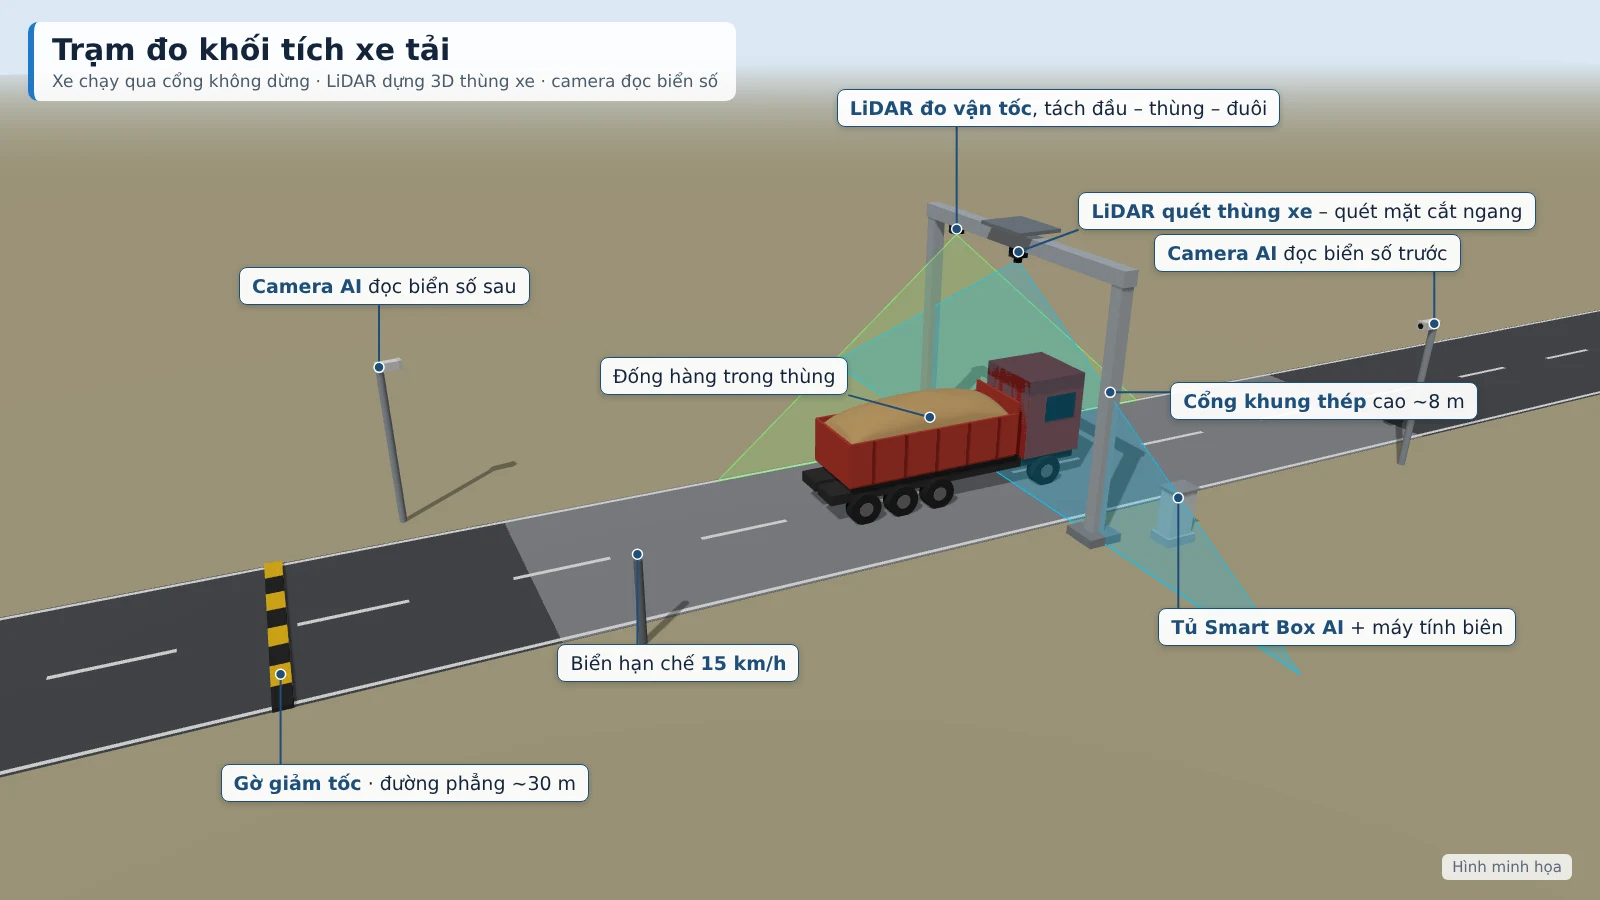
The truck station is installed at the entry/exit gate of the site, mine or storage yard; the barge station is installed on the channel into the wharf or inbound port. Trucks drive through a steel-frame gate at under 15 km/h without having to stop. The result for each trip includes inbound m³, residual m³ on exit, actual delivered m³ and converted tonnes, together with the license plate, photos and a 3D image of the cargo pile. The station applies to 2–4-axle dump trucks and open-top semi-trailers carrying sand, soil and stone.
4 common loopholes in controlling material-carrying vehicles
Managing by eye or by manual measurement leaves four main loopholes. Each loophole has a corresponding control mechanism in the system:
- Visual estimation and manual measurement of each trip. Everyone comes up with a different number, and there is no evidence to cross-check. The system replaces this with LiDAR measurements together with 3D images, photos and camera clips stored per trip.
- Underloaded trips, incomplete discharge. A truck enters with a low load and exits with cargo still left over, yet the trip is still counted in full. The system measures both on entry and on exit and records only the actual delivered m³.
- Swapping vehicles, raising the bed walls. The bed is extended or a different vehicle with a different capacity than registered is used. The system compares each measurement with the vehicle's registered bed profile.
- Stopping the vehicle flow for checks. Stopping each vehicle to measure causes congestion at the gate and slows site progress. With a LiDAR measurement gate, vehicles drive through without stopping.
3D LiDAR and AI technology in volume control
LiDAR measures distance using laser pulses; when continuously scanning a truck bed passing through, the sensor captures a point cloud describing the bed surface and the cargo pile. Smart Box AI builds a 3D model, measures the length, width and height of the bed and the cargo pile, then calculates the cargo m³ including the portion inside the bed and the portion protruding above the bed walls. The AI camera simultaneously reads the license plate before and after, and captures the clearest image of each pass.
Regarding accuracy, a volume error of ≤ ±3% for trucks (trips from 10 m³) and ≤ ±5% for barges compared with the reference is a proposed target, to be re-agreed by both parties based on the results of a 4-week trial run. Each measurement has a confidence score from 0 to 100 based on speed, occlusion level and weather; a poor measurement is automatically forwarded to staff for verification.
For barges, the system uses two independent methods: 3D scanning of the cargo hold and draft measurement on entry compared with on exit. The cargo surface is calculated according to the barge's own hold opening, not the water surface, so tides do not distort the result. When the tonnage by 3D scan and by draft differ by more than 8%, the trip is forwarded to staff for confirmation.
Automated volume measurement process
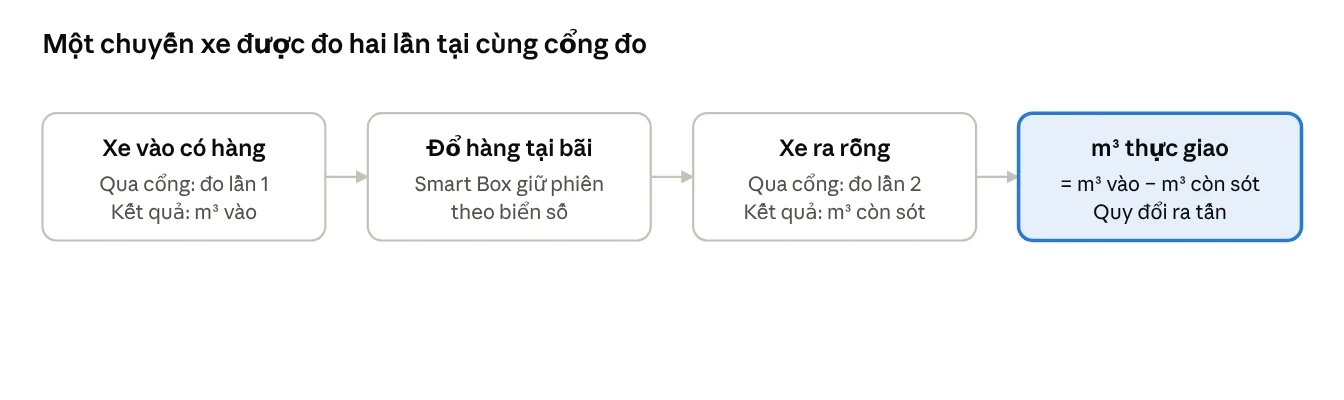
Each truck is measured twice per trip, at the same gate:
- On entry with cargo: the camera reads the license plate, LiDAR builds a 3D model of the cargo pile, the system calculates the inbound m³ and compares it with the bed profile.
- On exit empty: the gate re-measures the truck bed to determine the residual m³.
- Trip matching: the system matches the inbound loaded pass with the outbound empty pass of the same vehicle; actual delivered m³ = inbound m³ − residual m³.
- Conversion to tonnes according to the density table for each material type issued by the Investor.
A time to result of ≤ 30 seconds for trucks and ≤ 60 seconds for barges is a proposed target, to be re-agreed by both parties based on the results of a 4-week trial run. The density of sand, soil and stone varies with moisture, so the conversion table needs to be updated by the Investor according to the actual material types. Integrating data from the existing weighbridge via API to monitor actual density over time is a project-based extension item.
Automatic alert thresholds
Abnormal trips are flagged as soon as the vehicle passes the gate. Thresholds are configured by the Investor; alerts appear on the web app, on the TV at the security post and are sent as messages to the responsible staff.
| Criterion | Threshold | Meaning |
|---|---|---|
| Underloaded | Cargo m³ below the registered level (default 85% of bed capacity) | Truck enters with a partially filled bed |
| Over the walls | Cargo pile higher than the bed walls by more than 0.3 m | Cargo loaded above the bed walls |
| Incomplete discharge | Residual on exit greater than 0.5 m³ | The residual portion is not counted in the actual delivered m³ |
| Bed profile mismatch | Measured dimensions differ from the registered profile | Suspected vehicle swap or raised walls |
| Unknown vehicle | License plate not in the registered list | Vehicle outside the contractor list |
| Unable to measure | Vehicle still covered by a tarp, moving too fast, two vehicles too close together | Moved to the pending verification queue |
| Equipment | Loss of LiDAR, camera or power signal; sensor glass needs cleaning | Notify the technical department for handling |
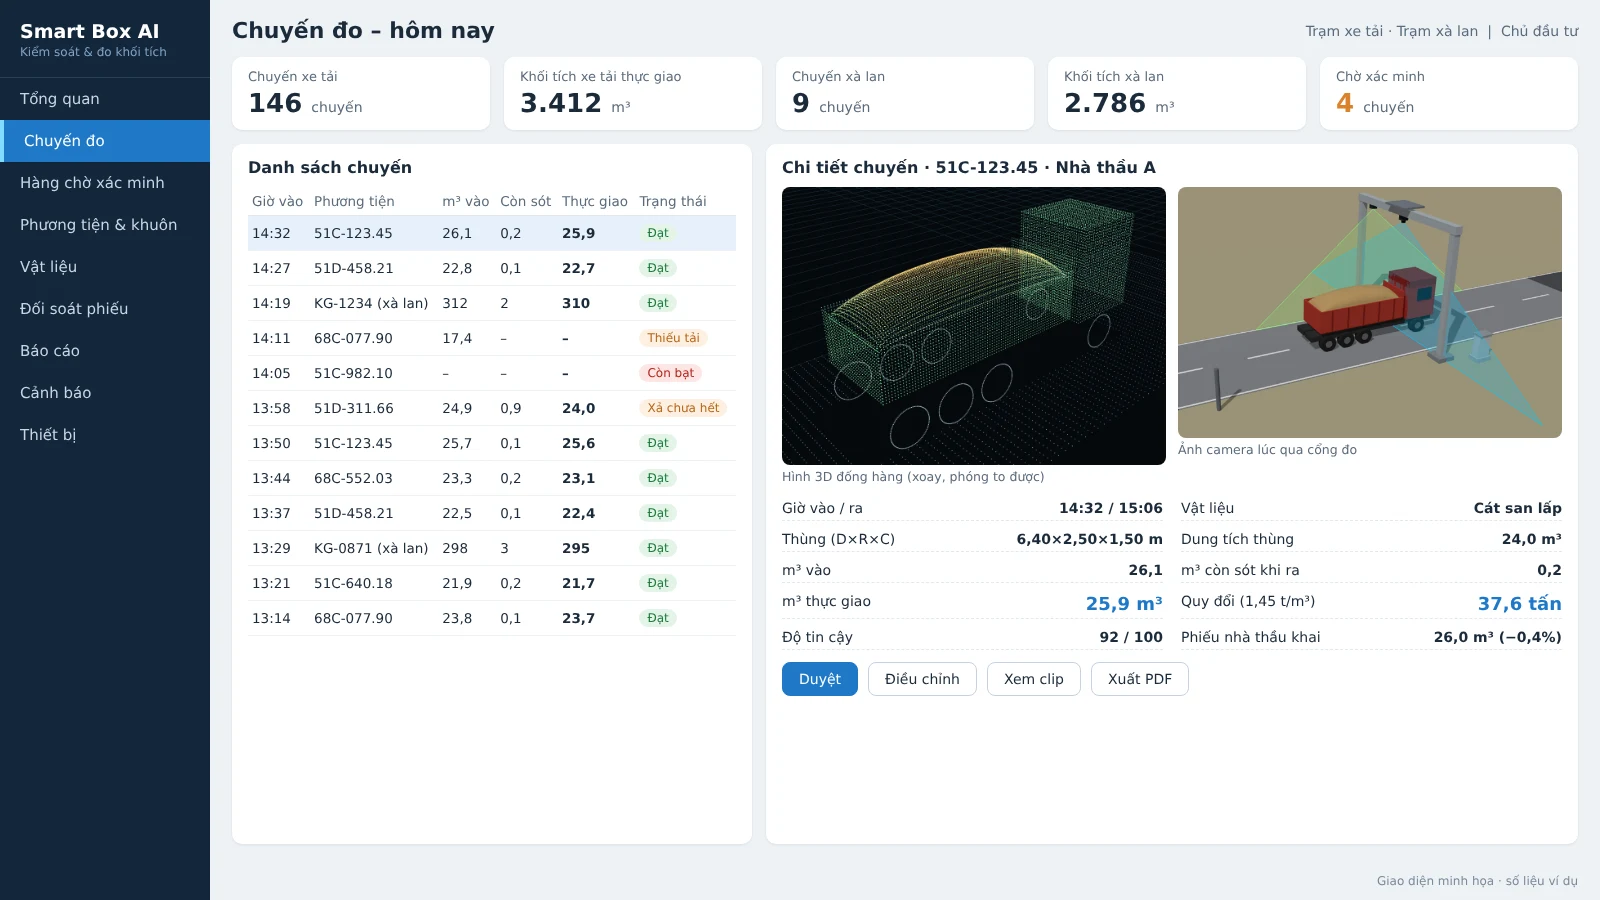
Security staff only need to confirm the trips flagged by the system. Staff view the images, 3D model and camera clips, then approve, adjust or reject; every change is logged.
Multi-point data reconciliation
The system reconciles data at three levels:
- Compare the measured m³ with the vehicle's registered capacity.
- Compare with the contractor's delivery note: declared m³, measured m³ and the difference.
- Reconcile vehicle passes across gates.
Reports by contractor and by individual vehicle show the average m³ per trip, the fill rate and the number of underloaded trips. This lets the Investor identify which contractor or vehicle repeatedly shows anomalies, instead of handling each individual trip in isolation.
Per-trip evidence for acceptance and payment
Each trip stores enough data for reconciliation during acceptance and payment with the contractor:
- Vehicle: front/rear license plate, contractor, clearest photo.
- Time: entry time, exit time, time spent inside the site.
- Dimensions: length, width, height of the truck bed and of the material pile.
- Volume: m³ in, m³ remaining, m³ actually delivered, portion of material protruding above the bed sides.
- Weight: tons converted by material type.
- Images: 3D image of the material pile, photos and camera clips at the gate crossing.
- Confidence: quality score of the measurement.
The payment reconciliation report lists the adjusted trips and the approver. Volume reports by day, shift, week, month separate trucks and barges, exported to Excel and PDF.
Uninterrupted operation
The system is designed so the site does not lose trips when infrastructure fails:
- Each station processes independently and produces results on site, and still measures when the connection is lost.
- Buffers at least 7 days of data and automatically resends when connectivity returns.
- Data is stored on site and on the project server; stations send results to the center via VPN.
- Monitors LiDAR, cameras, power supply, connectivity; alerts when the signal is lost or the sensor glass is dirty.
- IP65 electrical cabinet with fan and dehumidifier, UPS, power and network surge protection; the station runs 24/24.
Rules for contractors at the measurement gate
For control of sand, soil and stone trucks to be effective, the Investor needs to issue rules for contractors:
- Open the tarp before the measurement gate.
- Keep to the speed of 15 km/h for trucks, 5 km/h for barges.
- One vehicle through the gate at a time; exiting vehicles also pass through the measurement gate.
- Submit the list of trucks and barges of each contractor; barge registration documents (hold dimensions, draft).
The Investor also prepares the site for the measurement gate with a straight, flat road section of about 30 m before and after the gate, grid power or a generator to the station, and a specific gravity table by material type to convert m³ to tons.
Calibration and trial run before acceptance
The station is calibrated on site before the measurements are used for payment. The sequence includes: aligning the sensors with steel blocks of known dimensions; running each empty truck through 3 times at different speeds to build the bed template; verifying loaded trucks by leveling the material flush with the bed sides and measuring manually, and, where a weighbridge is available, cross-checking by tons as well. The system then runs a 4-week trial before acceptance.
Acceptance is based on 50 truck trips and 10 barge trips with cross-checks over 7 consecutive days. The software exports a comparison table of measured m³, reference m³ and the error for each trip for both parties to sign and confirm. After acceptance, the station is re-checked with standard blocks every month and after each relocation.
Related solutions
Truck & barge volume measurement — Smart Box AI: 3D LiDAR and AI cameras measure m³ per trip, vehicles do not have to stop; each trip has a license plate, photos and a 3D image as the basis for acceptance. View the solution, book an on-site survey →
Frequently asked questions
Does the system require vehicles to stop for measurement?
No. Trucks drive through the measurement gate at under 15 km/h without stopping; barges pass through the measurement frame at under 5 km/h along the buoy line. Vehicles must open their tarpaulins before the measurement gate, and only one vehicle may pass through the gate at a time.
How long does it take to get a measurement result?
A result time of ≤ 30 seconds for trucks and ≤ 60 seconds for barges is a proposed target, to be re-agreed by both parties based on the results of a 4-week trial run. Measurement takes place while the vehicle is driving through the gate, so the vehicle does not have to stop and wait.
How do I register a bed profile for a new vehicle?
The empty vehicle passes through the gate 3 times at different speeds. The system stores the bed interior dimensions and bed floor as the baseline for all subsequent measurements; dimensions that deviate from the profile will trigger a warning of a suspected vehicle change or sidewall raise.
Does the system connect to the software we are already using?
Yes. The system exports Excel/CSV and has an API to connect to the project's weighbridge or accounting software; the scope of integration is determined during the survey. Using weighbridge data to track actual bulk density over time is a project-based extension.
Who has the right to adjust measurement results?
The system assigns roles to the Investor, supervision, security, accounting and administration; only the Investor may adjust the m³ figures. Staff view photos, 3D images and camera clips before approving or adjusting. Every change is logged, and the reconciliation report lists adjusted trips and the approver.
Can the station measure without a network connection?
Yes. Each station processes independently and produces results on site, buffers data for at least 7 days and automatically resends it to the server once the connection is restored.
Need to control vehicles carrying sand, soil and stone at construction sites, mines or receiving ports? An Ninh Số surveys the site, demonstrates the measurement method and proposes a suitable station layout. Call the hotline 0796 700 777 or see the Smart Box AI truck and barge volume measurement solution.